Dissolved Inorganic Carbon (DIC)
- PI’s
Richard A. Feely (NOAA/PMEL)
Rik Wanninkhof (NOAA/AOML)
- Technicians
Andrew Collins (NOAA/PMEL)
Charles Featherstone (NOAA/AOML)
Sample Collection
Samples for DIC measurements were drawn (according to procedures outlined in the PICES Special Publication, Guide to Best Practices for Ocean CO2 Measurements [Dickson2007]) from Bullister style niskin bottles into ~310ml borosilicate glass flasks using platinum-cured silicone tubing. The flasks were rinsed once and filled from the bottom with care not to entrain any bubbles, overflowing by at least one-half volume. The sample tube was pinched off and withdrawn, creating a 6ml headspace and 0.12 ml of saturated HgCl2 solution was added as a preservative. The sample bottles were then sealed with glass stoppers lightly covered with Apiezon-L grease. DIC samples were collected from a variety of depths with approximately 10% of these samples taken as duplicates.
Equipment
The analysis was done by coulometry with two analytical systems (PMEL1 and PMEL2) used simultaneously on the cruise. Each system consisted of a coulometer (5015O UIC Inc) coupled with a Dissolved Inorganic Carbon Extractor (DICE). The DICE system was developed by Esa Peltola and Denis Pierrot of NOAA/AOML and Dana Greeley of NOAA/PMEL to modernize a carbon extractor called SOMMA ([Johnson1985], [Johnson1987], [Johnson1993], [Johnson1992], [Johnson1999]). The two DICE systems were set up in a seagoing container modified for use as a shipboard laboratory on the aft main working deck of the RV Roger Revelle.
DIC Analysis
In coulometric analysis of DIC, all carbonate species are converted to CO2 by addition of excess hydrogen ion (acid) to the seawater sample, and the evolved CO2 is swept into the titration cell of the coulometer with CO2 free dry air or compressed nitrogen where it reacts quantitatively with a proprietary reagent based on ethanolamine to generate hydrogen ions. In this process, the solution changes from blue to colorless, triggering a current through the cell and causing coulometric generation of OH- ions at the anode. The OH- ions react with the H+ and the solution turns blue again. A beam of light is shone through the solution, and a photometric detector at the opposite side of the cell senses the change in transmission. Once the percent transmission reaches its original value, the coulometric titration is stopped, and the amount of CO2 that enters the cell is determined by integrating the total change during the titration.
DIC Calculation
The amount of CO2 injected was calculated according to the 2007 PICES Special Publication.
Each DICE instrument has a modified SBE45 salinity sensor, but all DIC values were recalculated to a molar weight (µmol  ) using density obtained from the CTD’s salinity.
The DIC values were corrected for dilution resulting from the addition of 0.12 ml of saturated HgCl2 used for sample preservation. The correction factor used for this dilution is 1.000397. A correction was also applied for the offset from the Certified Reference Material (CRM). This additive correction was applied for each cell using the value of the CRM obtained at the beginning of the cell. The coulometer cell solution was replaced after 24-28 mg of carbon was titrated, typically after 10-12 hours of continuous use. The blanks (background noise per cell) ranged from 20-62.6 on DICE1 and 30-82.3 on DICE2.
Calibration, Accuracy, and Precision
The stability of each coulometer cell solution was confirmed three different ways.
Gas loops were always run at the beginning and usually at the end of each cell;
CRM’s supplied by Dr. A. Dickson of SIO, were measured near the beginning; and
Duplicate samples were run throughout the life of the cell solution.
Each coulometer was calibrated by injecting aliquots of pure CO2 (99.999%), as a standard, by means of an 8-port valve ([Wilke1993]) outfitted with two calibrated sample loops of different sizes (~1ml and ~2ml). The instruments were each separately calibrated at the beginning of each cell with a minimum of two sets of these gas loop injections; and when time allowed at the end of each cell to ensure no drift during the life of the cell.
The accuracy of the DICE measurement is determined with the use of standards, Certified Reference Materials (CRMs) consisting of filtered and UV irradiated seawater, supplied by Dr. A. Dickson of Scripps Institution of Oceanography (SIO).
The CRM accuracy is determined manometrically on land in San Diego and the DIC data reported have been corrected to batches 200 and 201 CRM values.
Batch 200 was used for the first 44 stations and batch 201 for the remaining 48.
The CRM certified values for batches 200 and 201 are 2022.46 µmol and 2048.19 µmol .
The summary table  lists information for the CRMs.
The precision of the two DICE systems can be demonstrated via the replicate samples.
Approximately 5% of the niskins sampled were duplicates taken as a check of our precision.
These replicate samples were interspersed throughout the station analysis for quality assurance and integrity of the coulometer cell solutions.
The average absolute difference from the mean of these replicates is 0.86 µmol ; No systematic differences between the replicates were  .
.
Summary
The overall performance of the analytical equipment was good during the cruise. No major equipment problems were encountered, nor other problems that wound up compromising the quality of the data we collected. As is standard operating procedure, the pipette calibrations will need to be repeated upon return to shore. Both systems ran with slightly higher than normal background noise (blanks) than we are used to seeing. It is believed this extra noise is due to the new bow thruster the Revelle had installed during the mid-life refit and the need for all thrusters (Z-drive included) to be calibrated so they work as a team. This extra instrument noise is apparent while on station but not while the ship is underway. Further supporting this belief, we had no extra background noise in Seattle or while tied up at the pier while in Guam before the first leg of P02. Even with this additional background noise, the overall precision and accuracy and comparison to the 2013 P02 data set leads us to believe the systems were not compromised by this higher blank. Including the duplicates, 2,672 samples were analyzed for dissolved inorganic carbon. Therefore, DIC analyzed approximately 75% of the niskins made available to us. The DIC data reported to the database directly from the ship are to be considered preliminary until a more thorough quality assurance can be completed shore side.
Calibration data during this cruise:
SYSTEM |
Average Gas Loop Cal Factor |
Pipette Volume |
Observed |
|---|---|---|---|
PMEL1 |
1.00535 |
27.571 ml |
0.80 |
PMEL2 |
1.00394 |
26.363 ml |
0.91 |
CRM Info |
PMEL1 |
PMEL2 |
||||
|---|---|---|---|---|---|---|
Batch - Cert. |
Ave |
N |
Std Dev |
Ave |
N |
Std Dev |
200 - 2022.46 |
2022.76 |
21 |
1.53 |
2022.07 |
21 |
1.59 |
201 - 2048.19 |
2047.92 |
26 |
1.12 |
2048.61 |
25 |
1.88 |
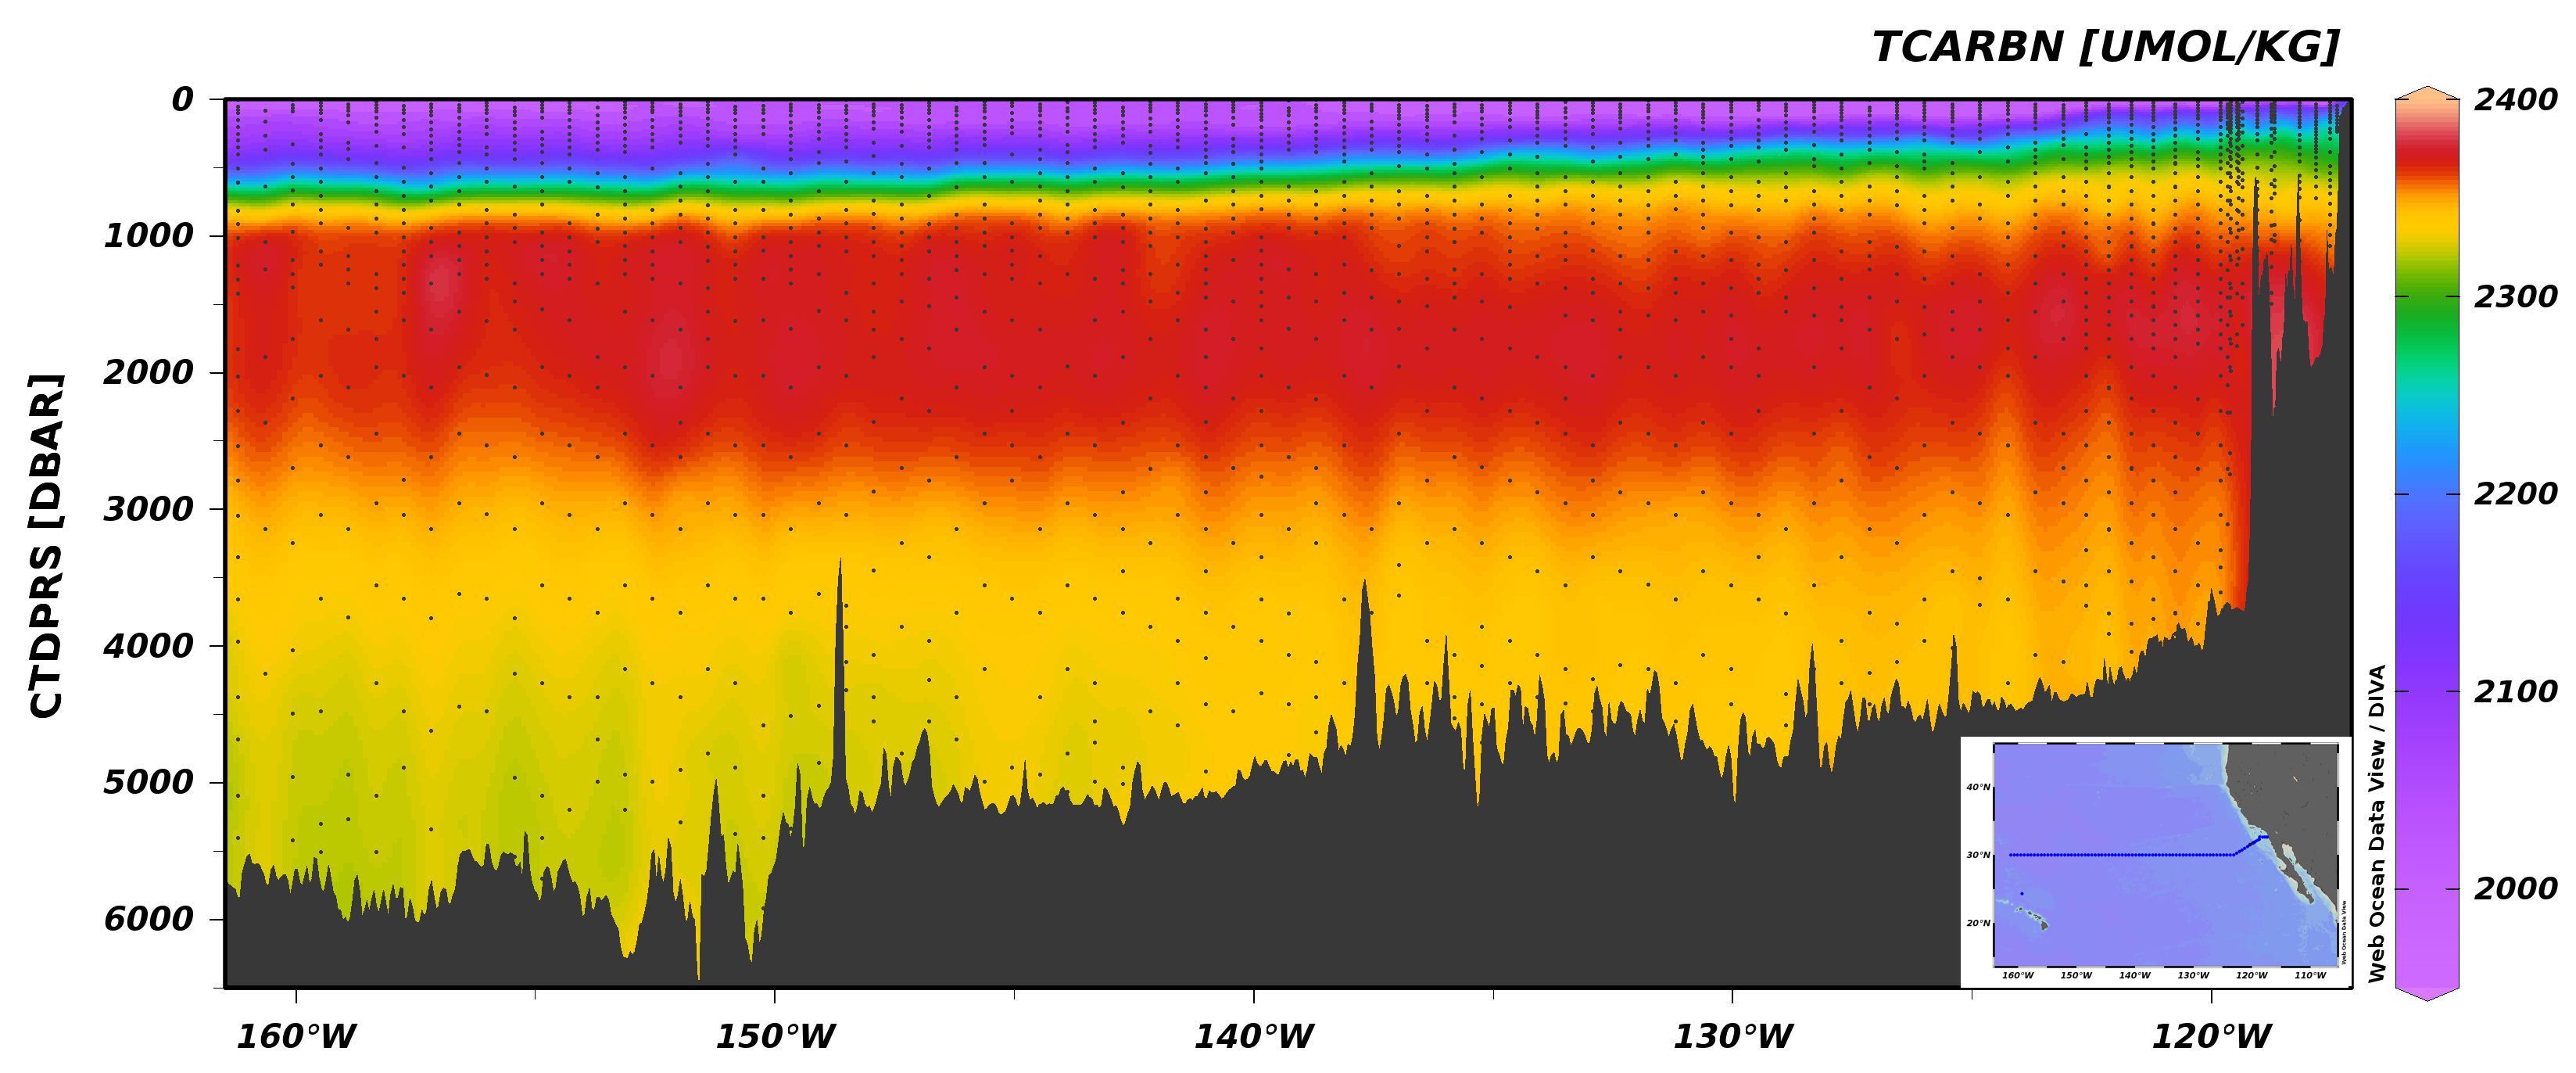
Section plot of DIC from Leg 2 of P02.
- Dickson2007
Dickson, A.G., Sabine, C.L. and Christian, J.R. (Eds.), (2007): Guide to Best Practices for Ocean CO2 Measurements. PICES Special Publication 3, 191 pp.
- Johnson1985
Johnson, K.M., A.E. King, and J. McN. Sieburth (1985): “Coulometric DIC analyses for marine studies: An introduction.” Mar. Chem., 16, 61-82.
- Johnson1987
Johnson, K.M., P.J. Williams, L. Brandstrom, and J. McN. Sieburth (1987): “Coulometric total carbon analysis for marine studies: Automation and calibration.” Mar. Chem., 21, 117-133.
- Johnson1992
Johnson, K.M. (1992): Operator’s manual: “Single operator multiparameter metabolic analyzer (SOMMA) for total carbon dioxide (CT) with coulometric detection.” Brookhaven National Laboratory, Brookhaven, N.Y., 70 pp.
- Johnson1993
Johnson, K.M., K.D. Wills, D.B. Butler, W.K. Johnson, and C.S. Wong (1993): “Coulometric total carbon dioxide analysis for marine studies: Maximizing the performance of an automated continuous gas extraction system and coulometric detector.” Mar. Chem., 44, 167-189.
- Johnson1999
Johnson, K.M., Körtzinger, A.; Mintrop, L.; Duinker, J.C.; and Wallace, D.W.R. (1999). Coulometric total carbon dioxide analysis for marine studies: Measurement and interna consistency of underway surface TCO2 concentrations. Marine Chemistry 67:123–44.
- Wilke1993
Wilke, R.J., D.W.R. Wallace, and K.M. Johnson (1993): “Water-based gravimetric method for the determination of gas loop volume.” Anal. Chem. 65, 2403-2406