Cruise Narrative
After mobilization on June 12 the R/V Roger Revelle left Honolulu port around 1900 and headed toward the final station of leg one (station 117), which was to be re-occupied as the first station of leg 2. Before reaching the first station, shortly after noon on June 13 two shallow test dips of the CTD rosette were carried out along the way (station 901) to provide training for the student watch standers, to verify that all instruments are working and to provide the new cruise participants the opportunity to become familiar with the CTD cast logistics and sampling. After successful completion the vessel proceeded to the first station of the P2 section.
While the first CTD cast of the P2 section (station 118) was collected without problems, soon after the CTD was on deck it was discovered that the arm of the primary winch system (CAST6) was leaking hydraulic oil, which took it out of commission for the remainder of the cruise. The first two attempts at collecting a profile with the backup winch (DESH5) had to be aborted due to communications problems between the fish and the deck box. After solving the underlying problem by removing 100m of CTD wire the system performed well for the remainder of the cruise. Due to necessity of training new winch operators, many of the profiles collected during the first week had winch stops during the downcasts, usually near 100m but sometimes also about 200m above the sea bed. Additionally a conservative wire tension limit of 4000lbs prevented winch speeds greater than 20m/min during the initial parts of the upcasts until it was determined that the slow speed did not actually decrease wire tension significantly. Also during the first week there were many Niskin bottle problems including several broken lanyards and one bottle that was lost entirely, presumably because it inadvertently closed during the deployment with air trapped inside. The bottle problems persisted until most of the lanyards were replaced.
Progressing eastward along 30N stations were occupied every 30nm. The 2022 re-occupation of P2 is the first US GO-SHIP cruise carried out with additional sampling time allocated to the recently funded Bio GO-SHIP program. Beginning on station 120 every third full-depth CTD cast was therefore preceded by a “bio cast” to 1000m, where water was collected for a variety of biologically relevant parameters, some of which require large sampling volumes. Samples of the same parameters were also collected several times per day, guided by solar day time, using the flow-through system fed by a diaphragm pump (instead of the usual impeller pump) in order to preserve planktonic particles for sampling. Additionally, while on station the multifrequency EK80 sonar system was used to record vertical distributions of backscattering organisms in the water column.
Profiles 118-142 were collected inside the subtropical gyre, characterized by warm sea surface temperatures and generally low particle loads throughout the water column, as indicated by low levels of acoustic backscatter in the LADCP data. After an oblique crossing of the subtropical front on stations 143-153 the vessel entered waters affected by the California Current System, as indicated by a salinity minimum near 200m and colder sea surface temperatures (Fig. 1). The cruise track continued eastward along 30N to 123W (station 185) where it turned northeastward to follow the original WOCE line from 1993 across the continental slope, which is also sampled as part of the CalCOFI program as line 93.3. (A request for a somewhat more northerly crossing of the continental slope along CalCOFI line 90, which has been sampled continuously with gliders since 2007, was denied by the Navy.) Between 119W and 120W the cruise crossed the steep continental slope where station spacing was reduced considerably (min 0.98 nm) in order to avoid bottom-depth steps greater than 500m between adjacent profiles. The track continued on the shelf along the same heading up to 118:45 W where a northward dog-leg was required in order to avoid Navy operations in the FLETA HOT area. As a result, station 200 planned at 32:28.44 N 118:27.18 W was shifted northwestward by the Navy to 32:37.33 N 118:40.68 W, from where the remaining stations were collected in final zonal section following the final approach to San Diego carried out during the 2004 (CLIVAR) and 2013 (GO-SHIP) occupations of the P2 repeat-hydrography section.
Due to a lack of weather and significant technical delays the vessel arrived at the easternmost station (#204) several days before the scheduled end of the cruise, even though additional sampling time between CTD profiles had been added beginning at station 186 in order to allow for a more complete sampling of the Niskin bottles by the CFC and carbon parameter analysis groups. The available time was used to re-sample part of the California Current System, starting at station 191 and working westward until station 186.
During the cruise, four BGC Argo Floats were deployed along the P2 section near 159W, 145 W, 131 W and 120 W, all without problems. All four floats returned their first profiles within a few hours of deployment, indicating that the sensors were working correctly.
The main purpose of the GO-SHIP repeat-hydrography program is to monitor the full depth ocean for long-term changes, includes the effects of global warming. Based on a subsection along 30 N between 160 and 145 W in the subtropical gyre, the upper ocean has warmed considerably compared to the base-line measurements collected during WOCE in 1993 with most of the change occurring between 2004 and 2013 (Fig. 2). In contrast to the upper ocean, the temperature at depths below 4000m has been increasing consistently since 1993, with the bottom-intensified warming rate increasing with time (Fig. 3). This abyssal warming is likely the result of a reduction in the volume of bottom water. Based on bottle salinities it appears that the abyssal warming has been accompanied by a freshening (Fig. 4) but it must be noted that the differences are smaller than the uncertainty of the salinity calibration, which include differences between different batches of standard sea water. CTD salinity differences compared to 1993 and 2004 are dominated by measurement artifacts (not shown) but the apparent abyssal differences between the 2013 and 2022 occupations of P2 are consistent with a freshening accompanying the recent warming of abyssal waters (Fig. 5).
A variety of tracers are measured as part of GO-SHIP, including SF6 (Sulfur Hexafluoride). On two stations on the California shelf (200 and 203) large concentrations of SF6 peaking at the seabed were observed (Fig. 6). The near-bottom SF6 concentration on station 200 peaks at more than twice atmospheric values, implying a source on or near the seabed. A google search revealed that SF6 is used in the propulsion system of Navy Mark 50 torpedoes making this the most likely source. While the highest SF6 concentrations were observed on the shelf, anomalies near 1000m most likely related to this source were observed several hundreds of miles off shore. A plan to re-sample station 200 at the end of the cruise in order to verify persistence of the signal there had to be aborted because the SF6 analysis system broke upon arriving at the station and repair was not feasible within the available time.
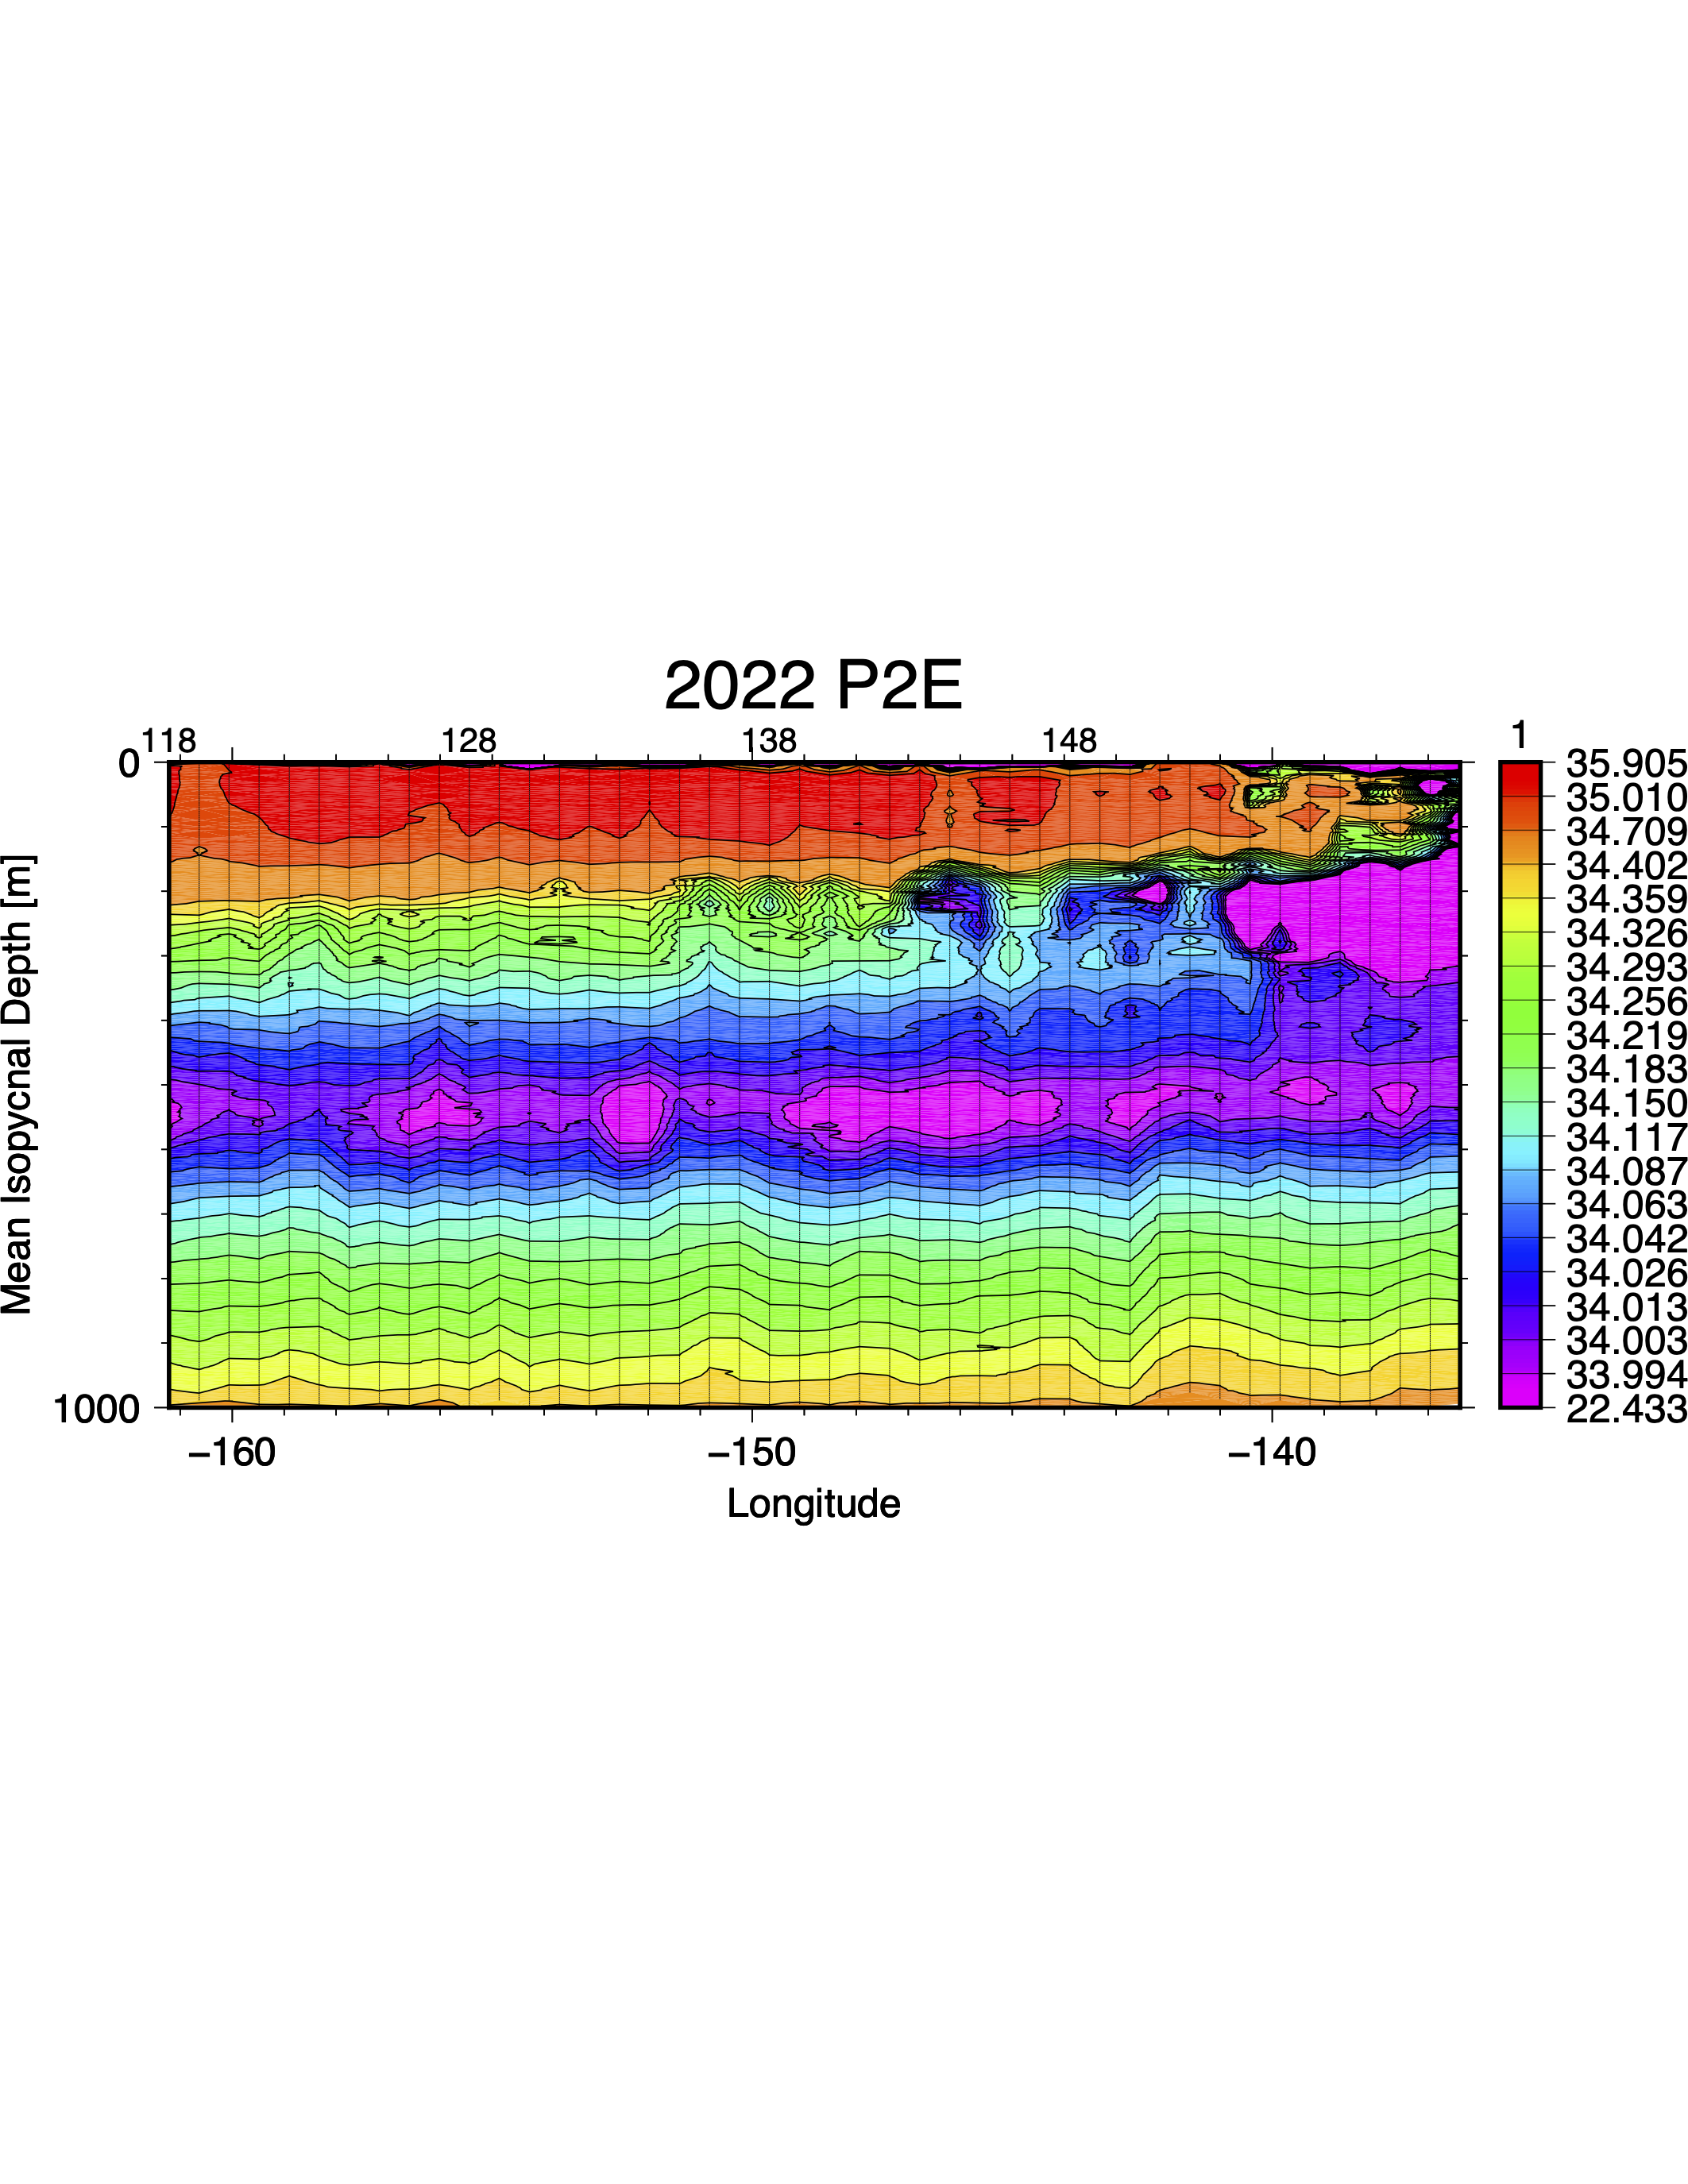
Isopycnally mapped upper-ocean salinity along 30N.
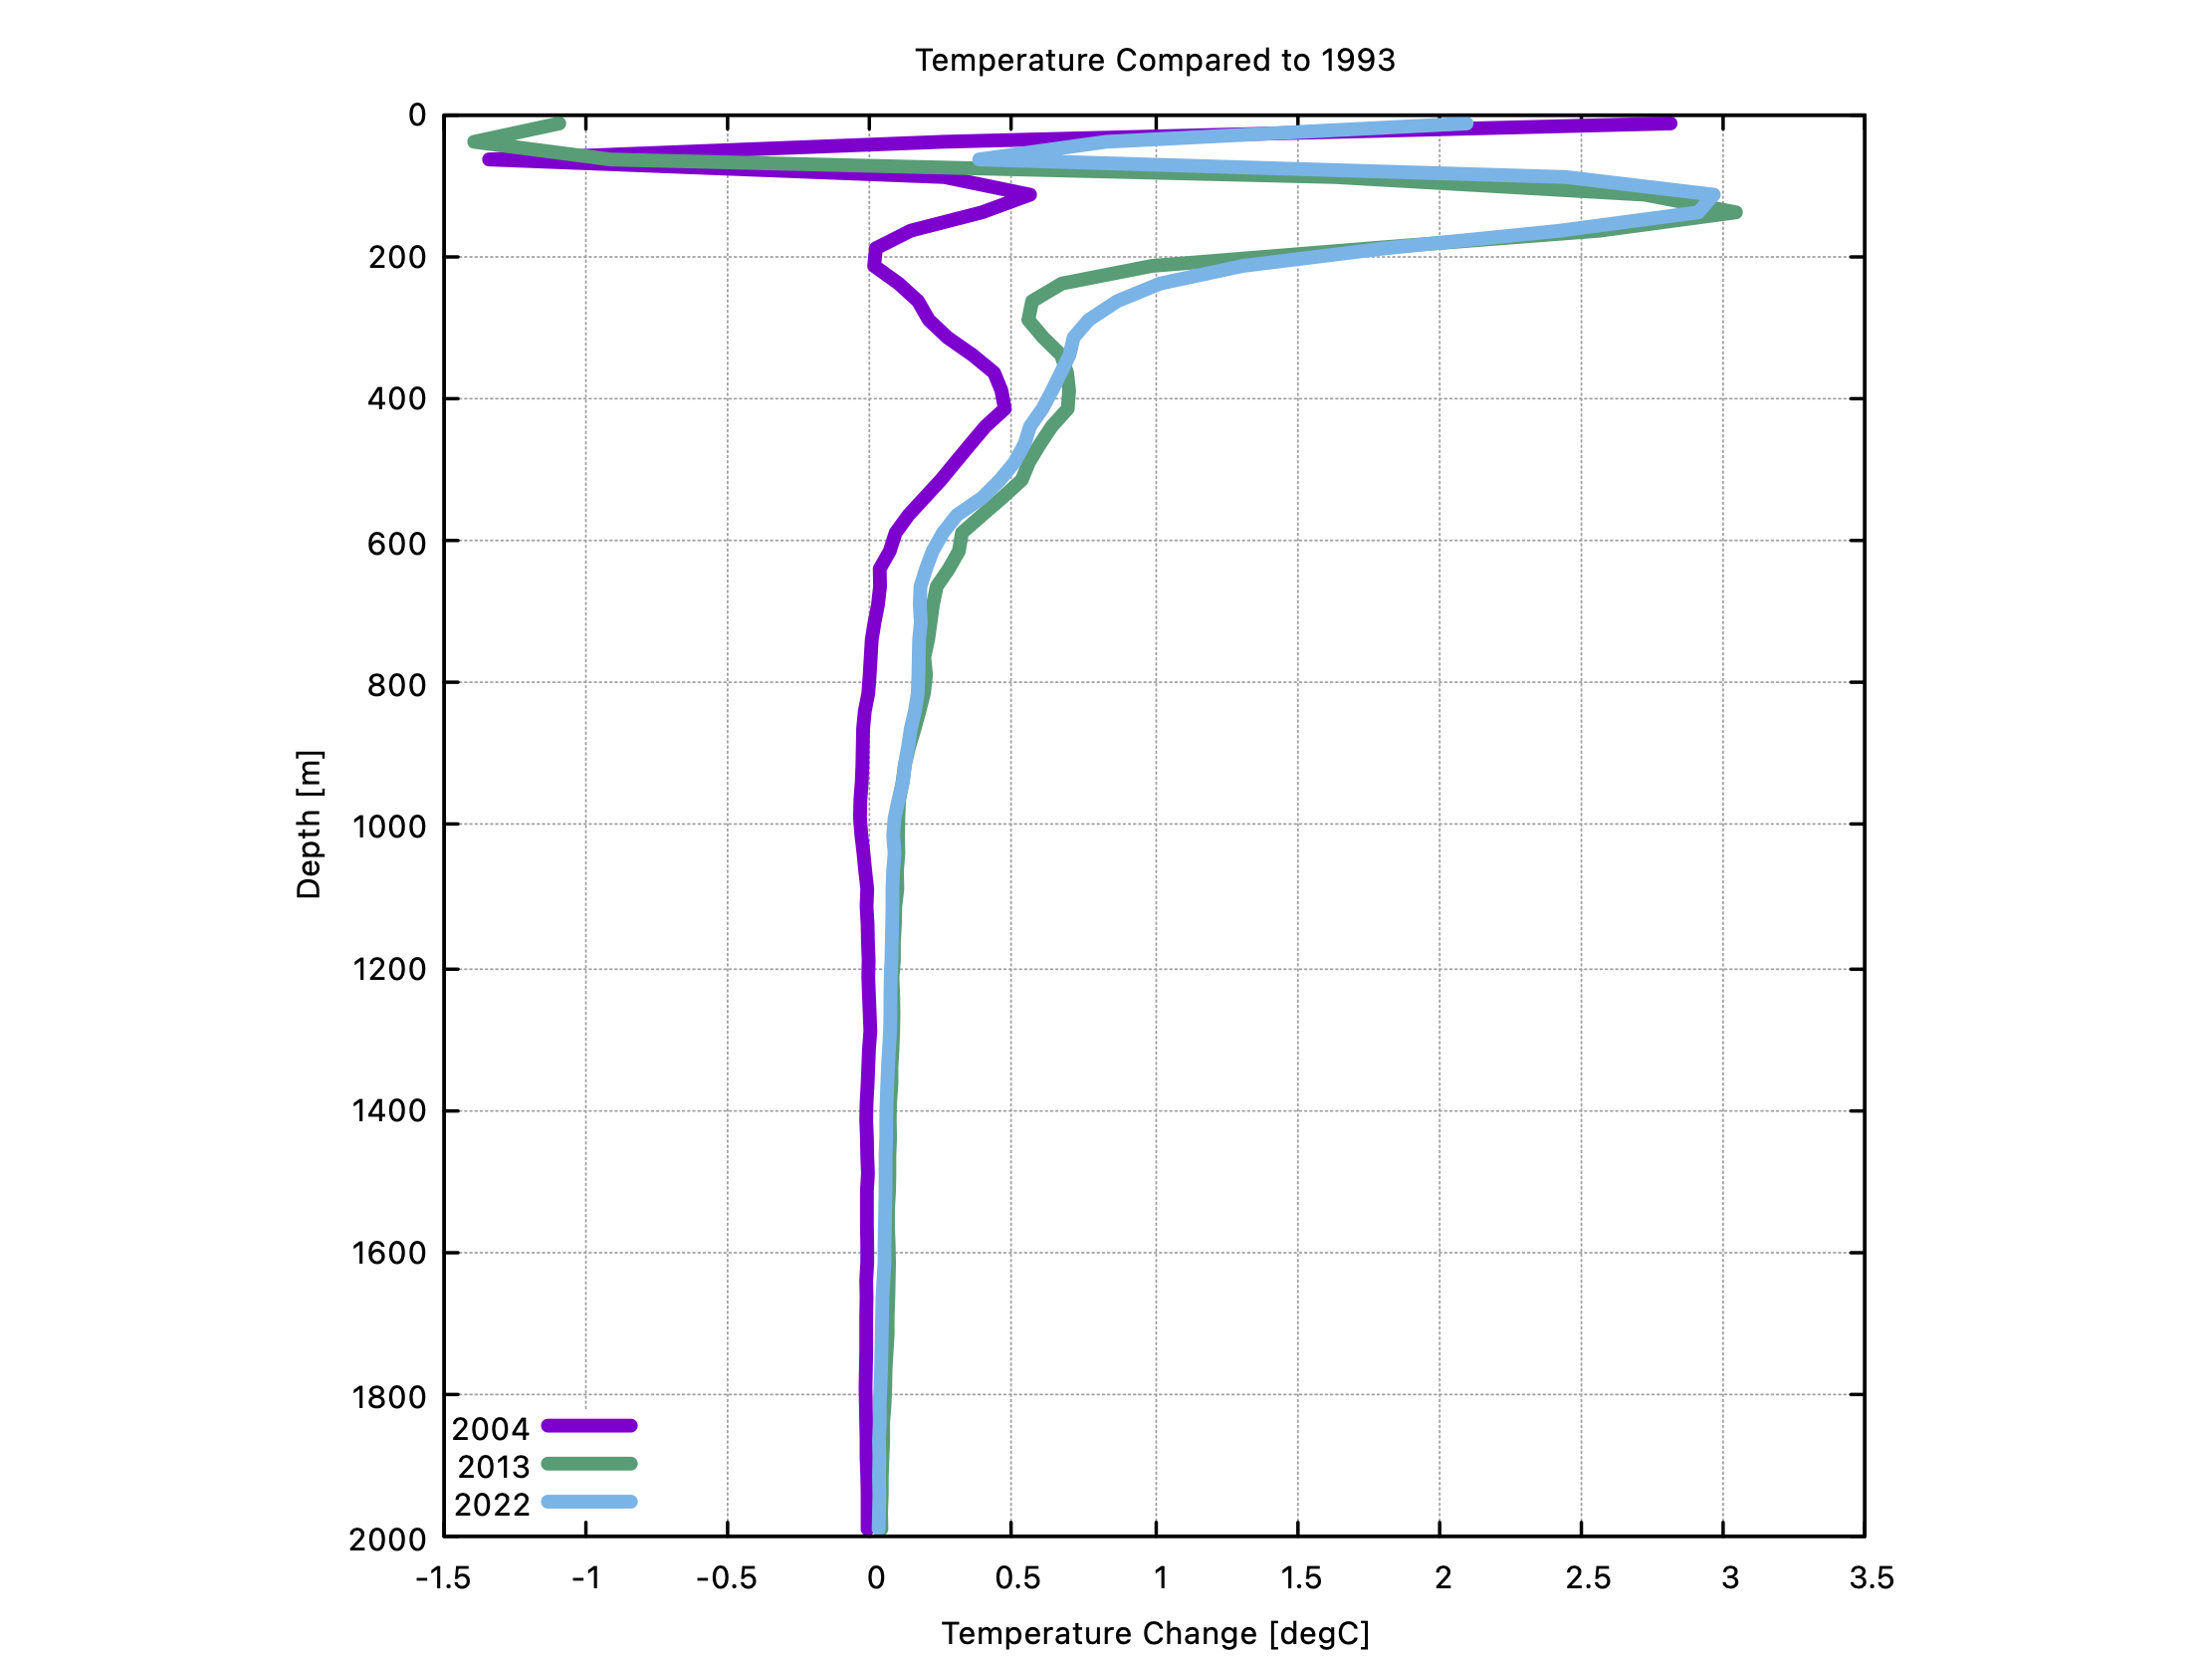
Upper-ocean profiles of average temperature differences between 160 and 145W compared to the WOCE base-line hydrography collected in 1993.
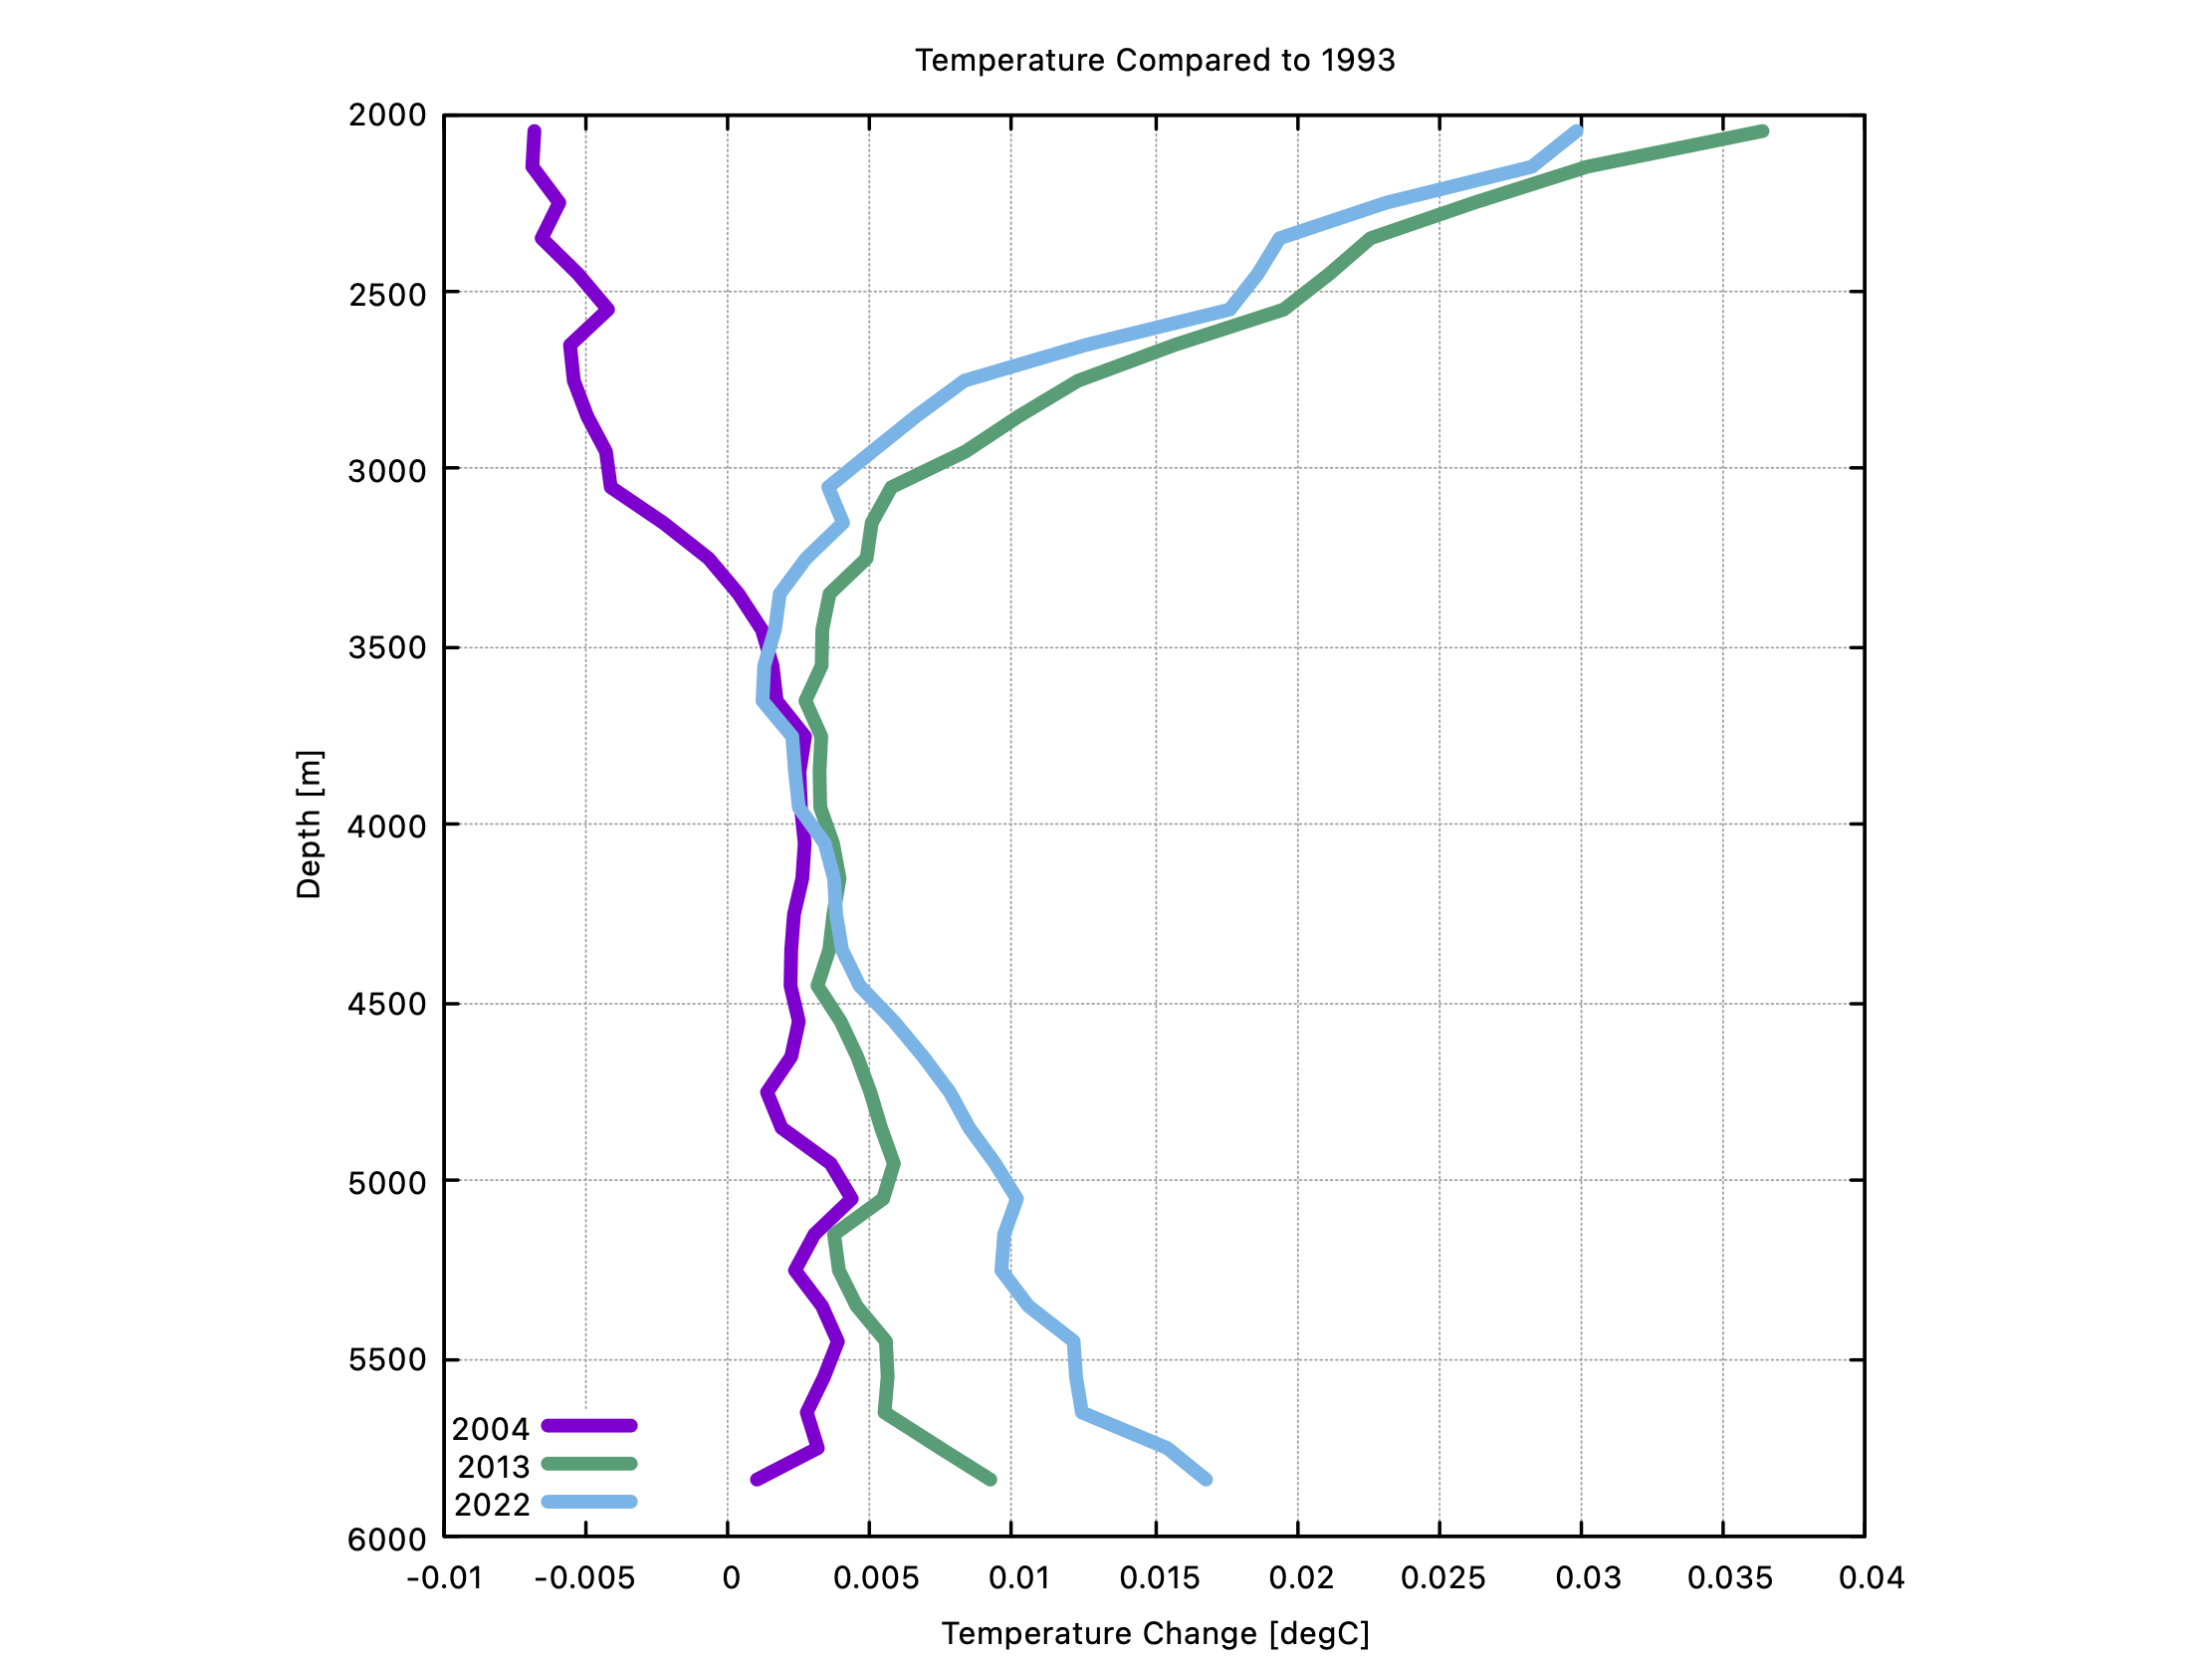
Abyssal-ocean profiles of average temperature differences between 160 and 145W compared to the WOCE base-line hydrography collected in 1993.
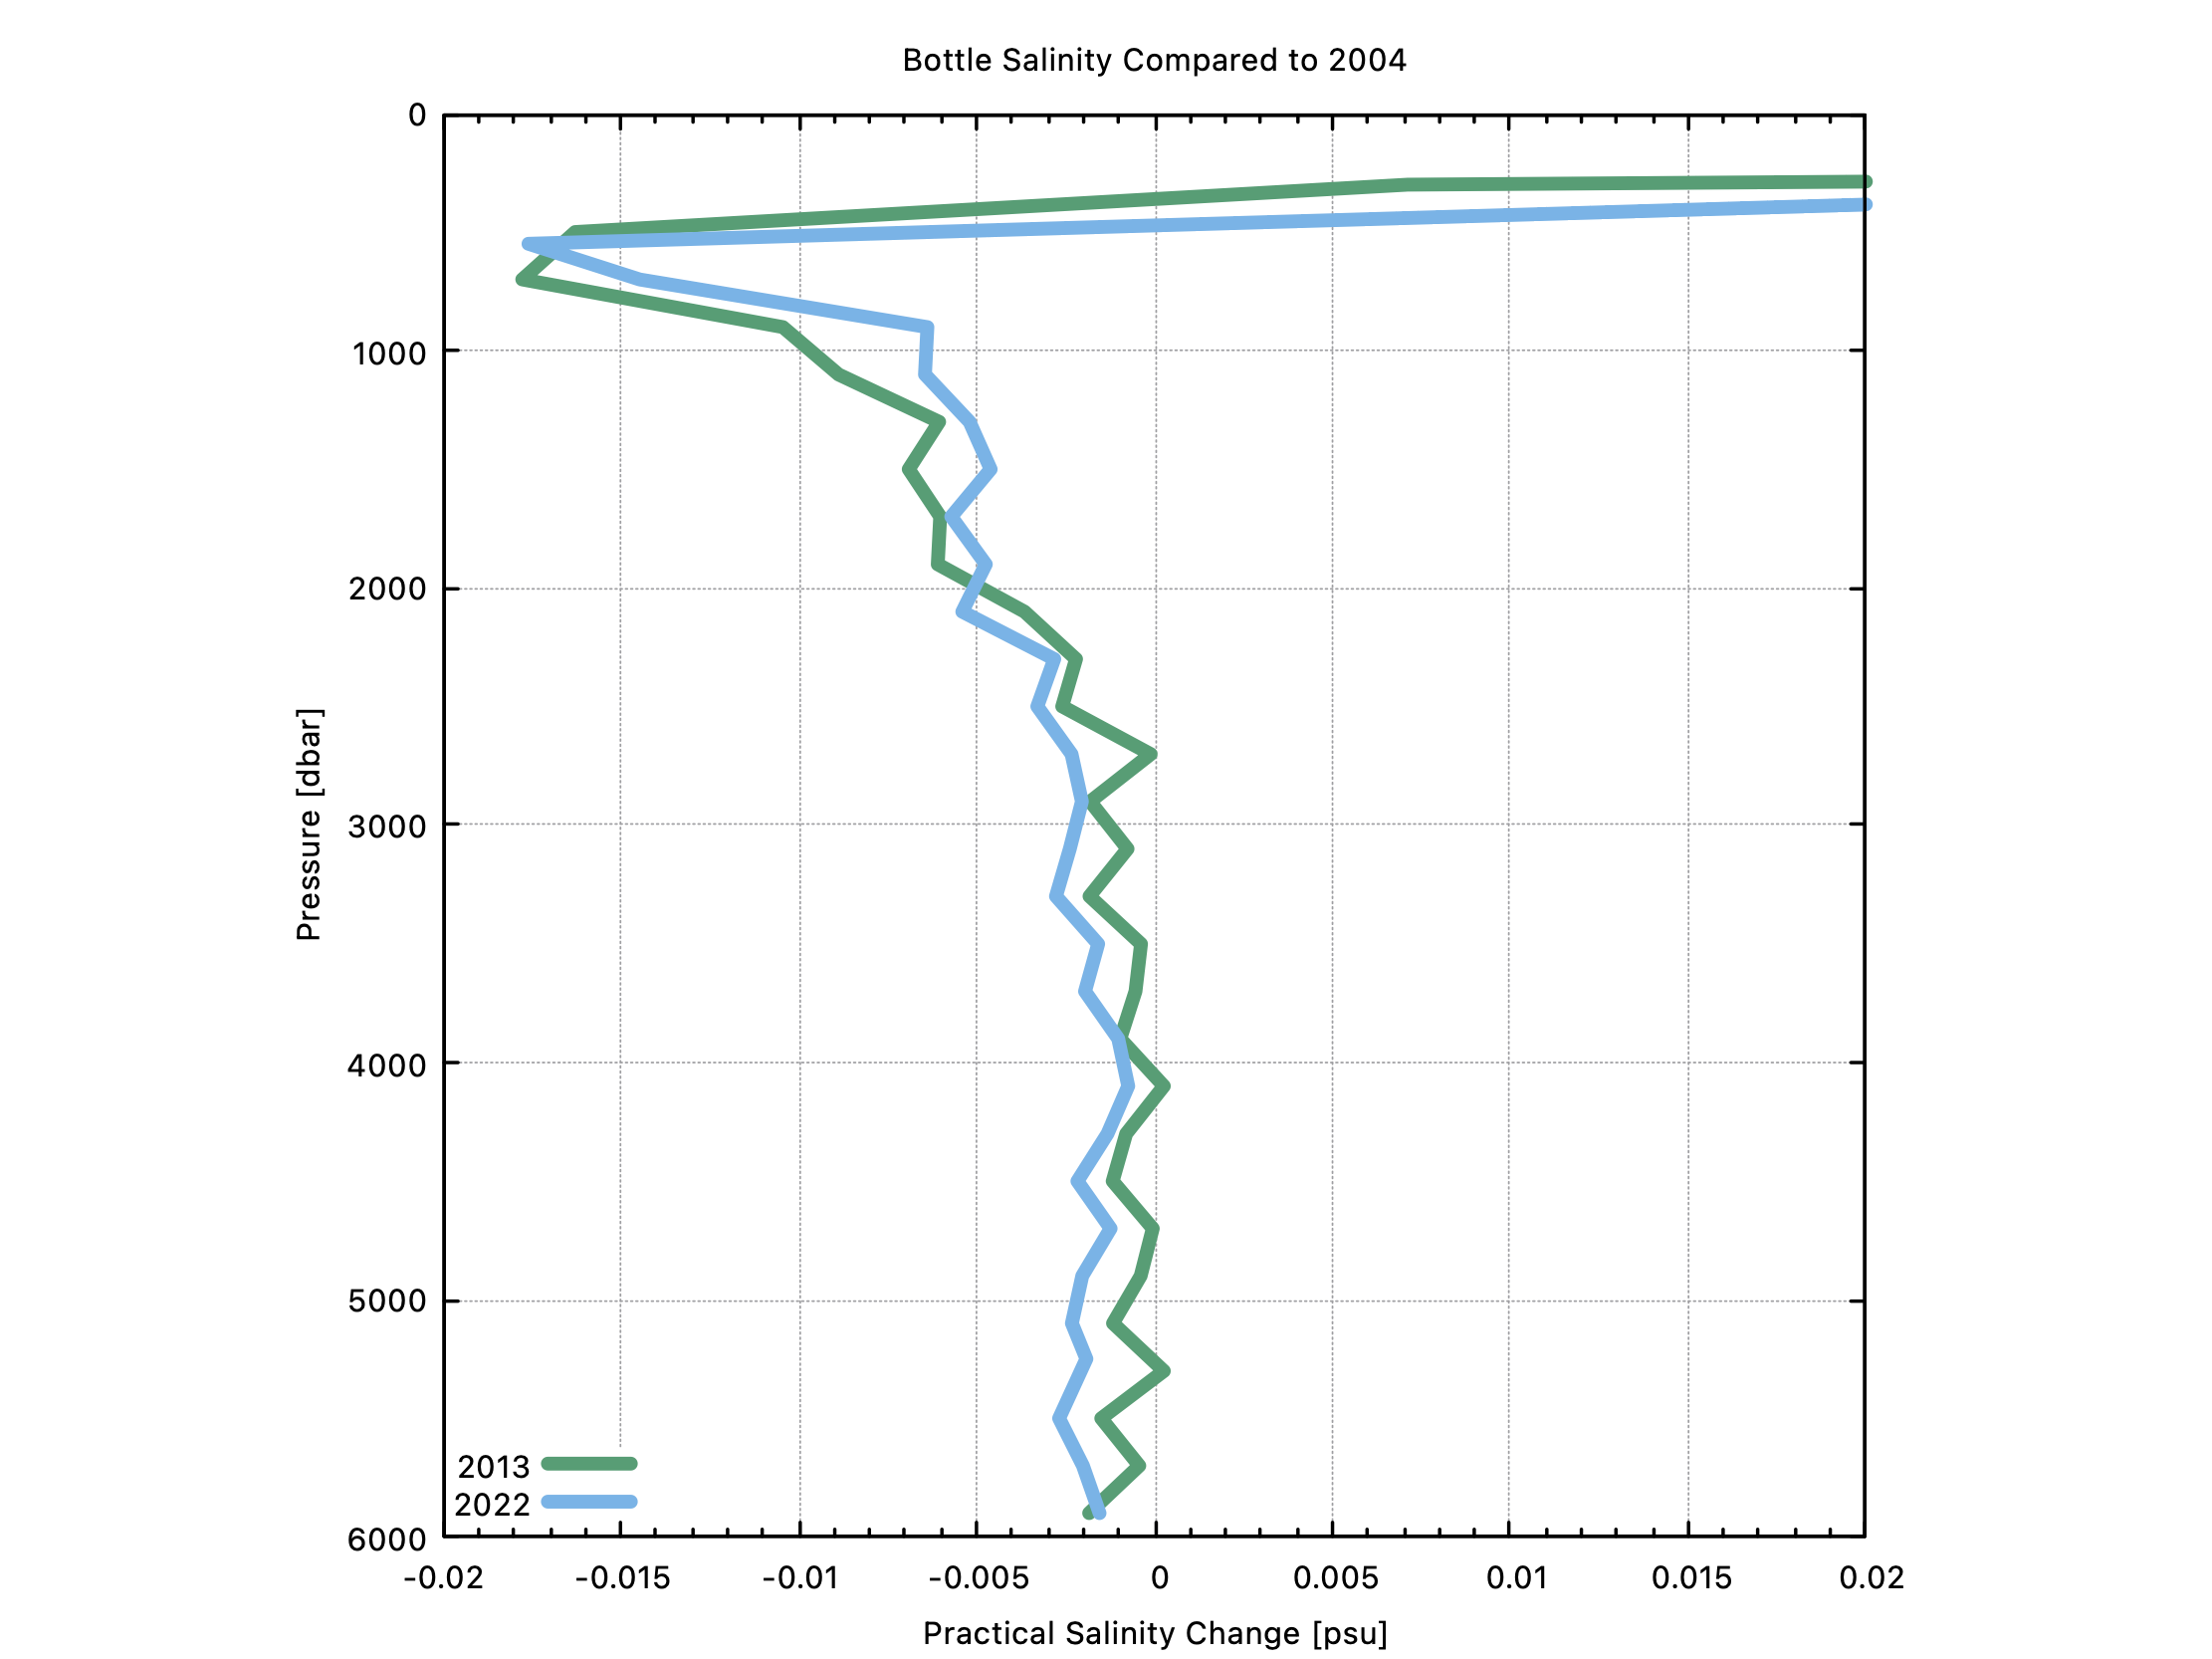
Profiles of average salinity differences from bottle samples between 160 and 145W compared to the CLIVAR hydrography collected in 2004. (The 1993 WOCE bottle salinities are not consistent with the apparent freshening trend.)
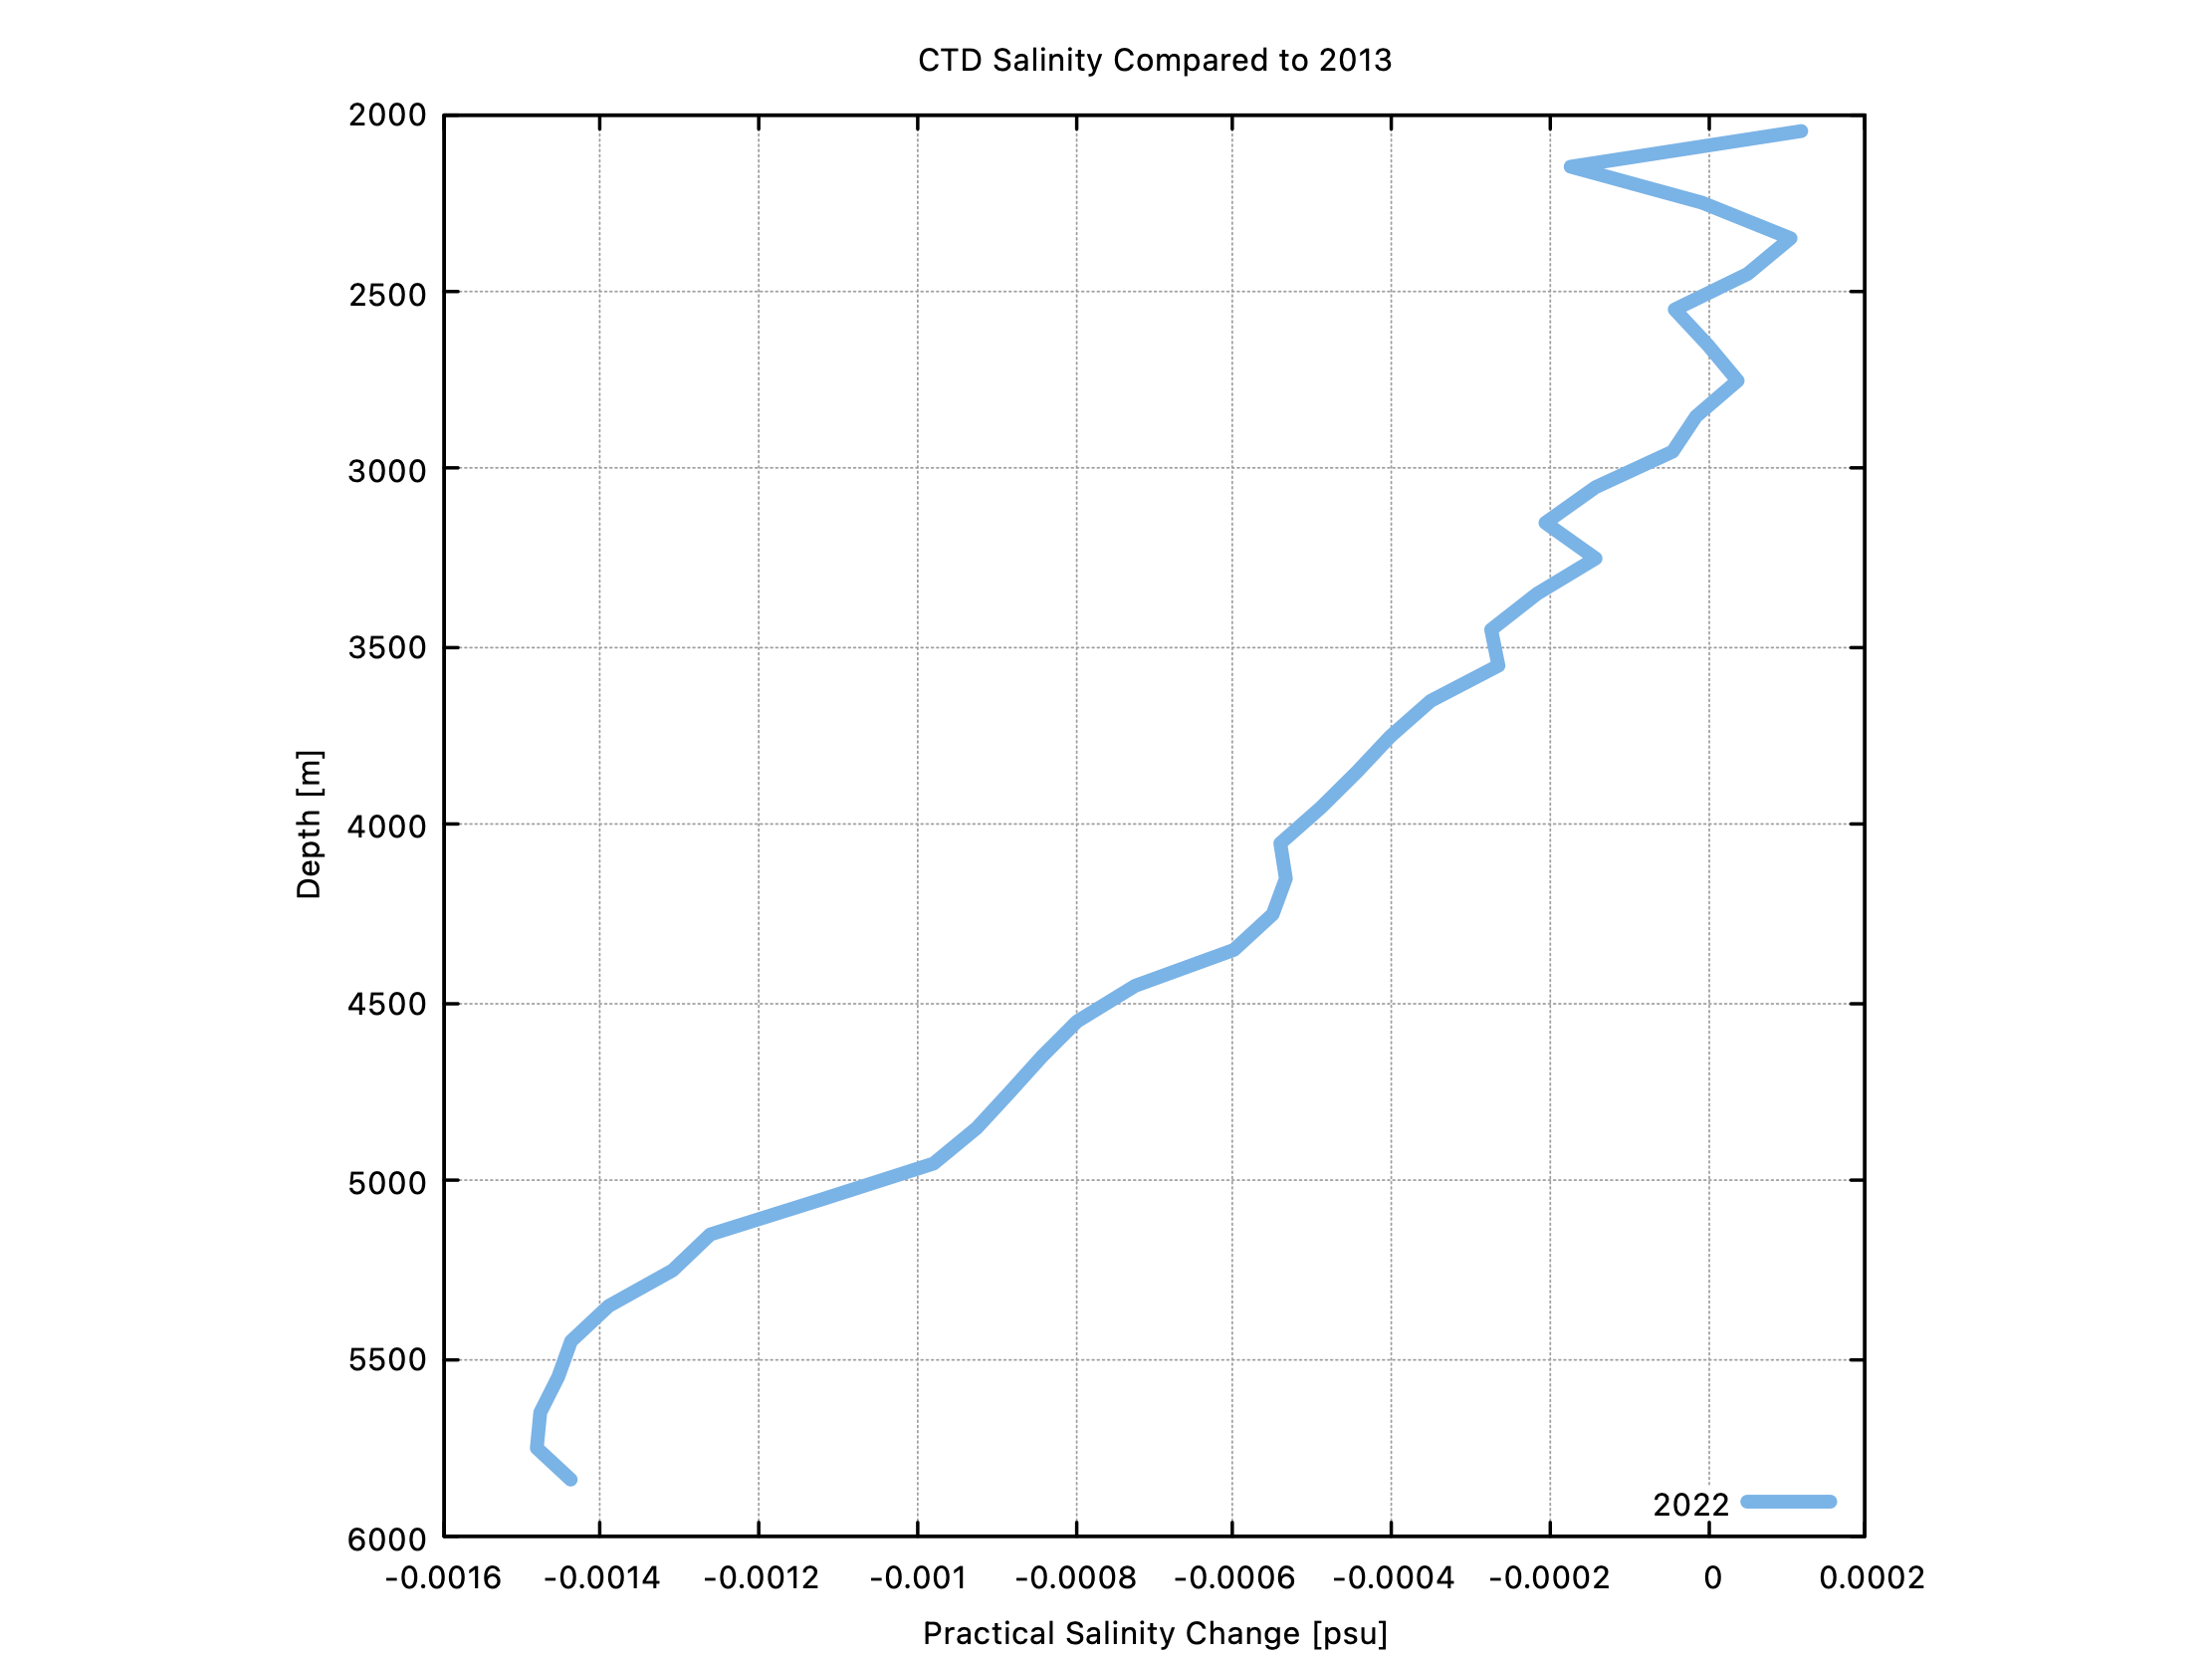
Abyssal-ocean profiles of average salinity differences from CTD measurements between 160 and 145W compared to the CLIVAR hydrography collected in 2013. (The CTD salinities collected in 1993 and 2004 are not consistent with the apparent freshening trend.)
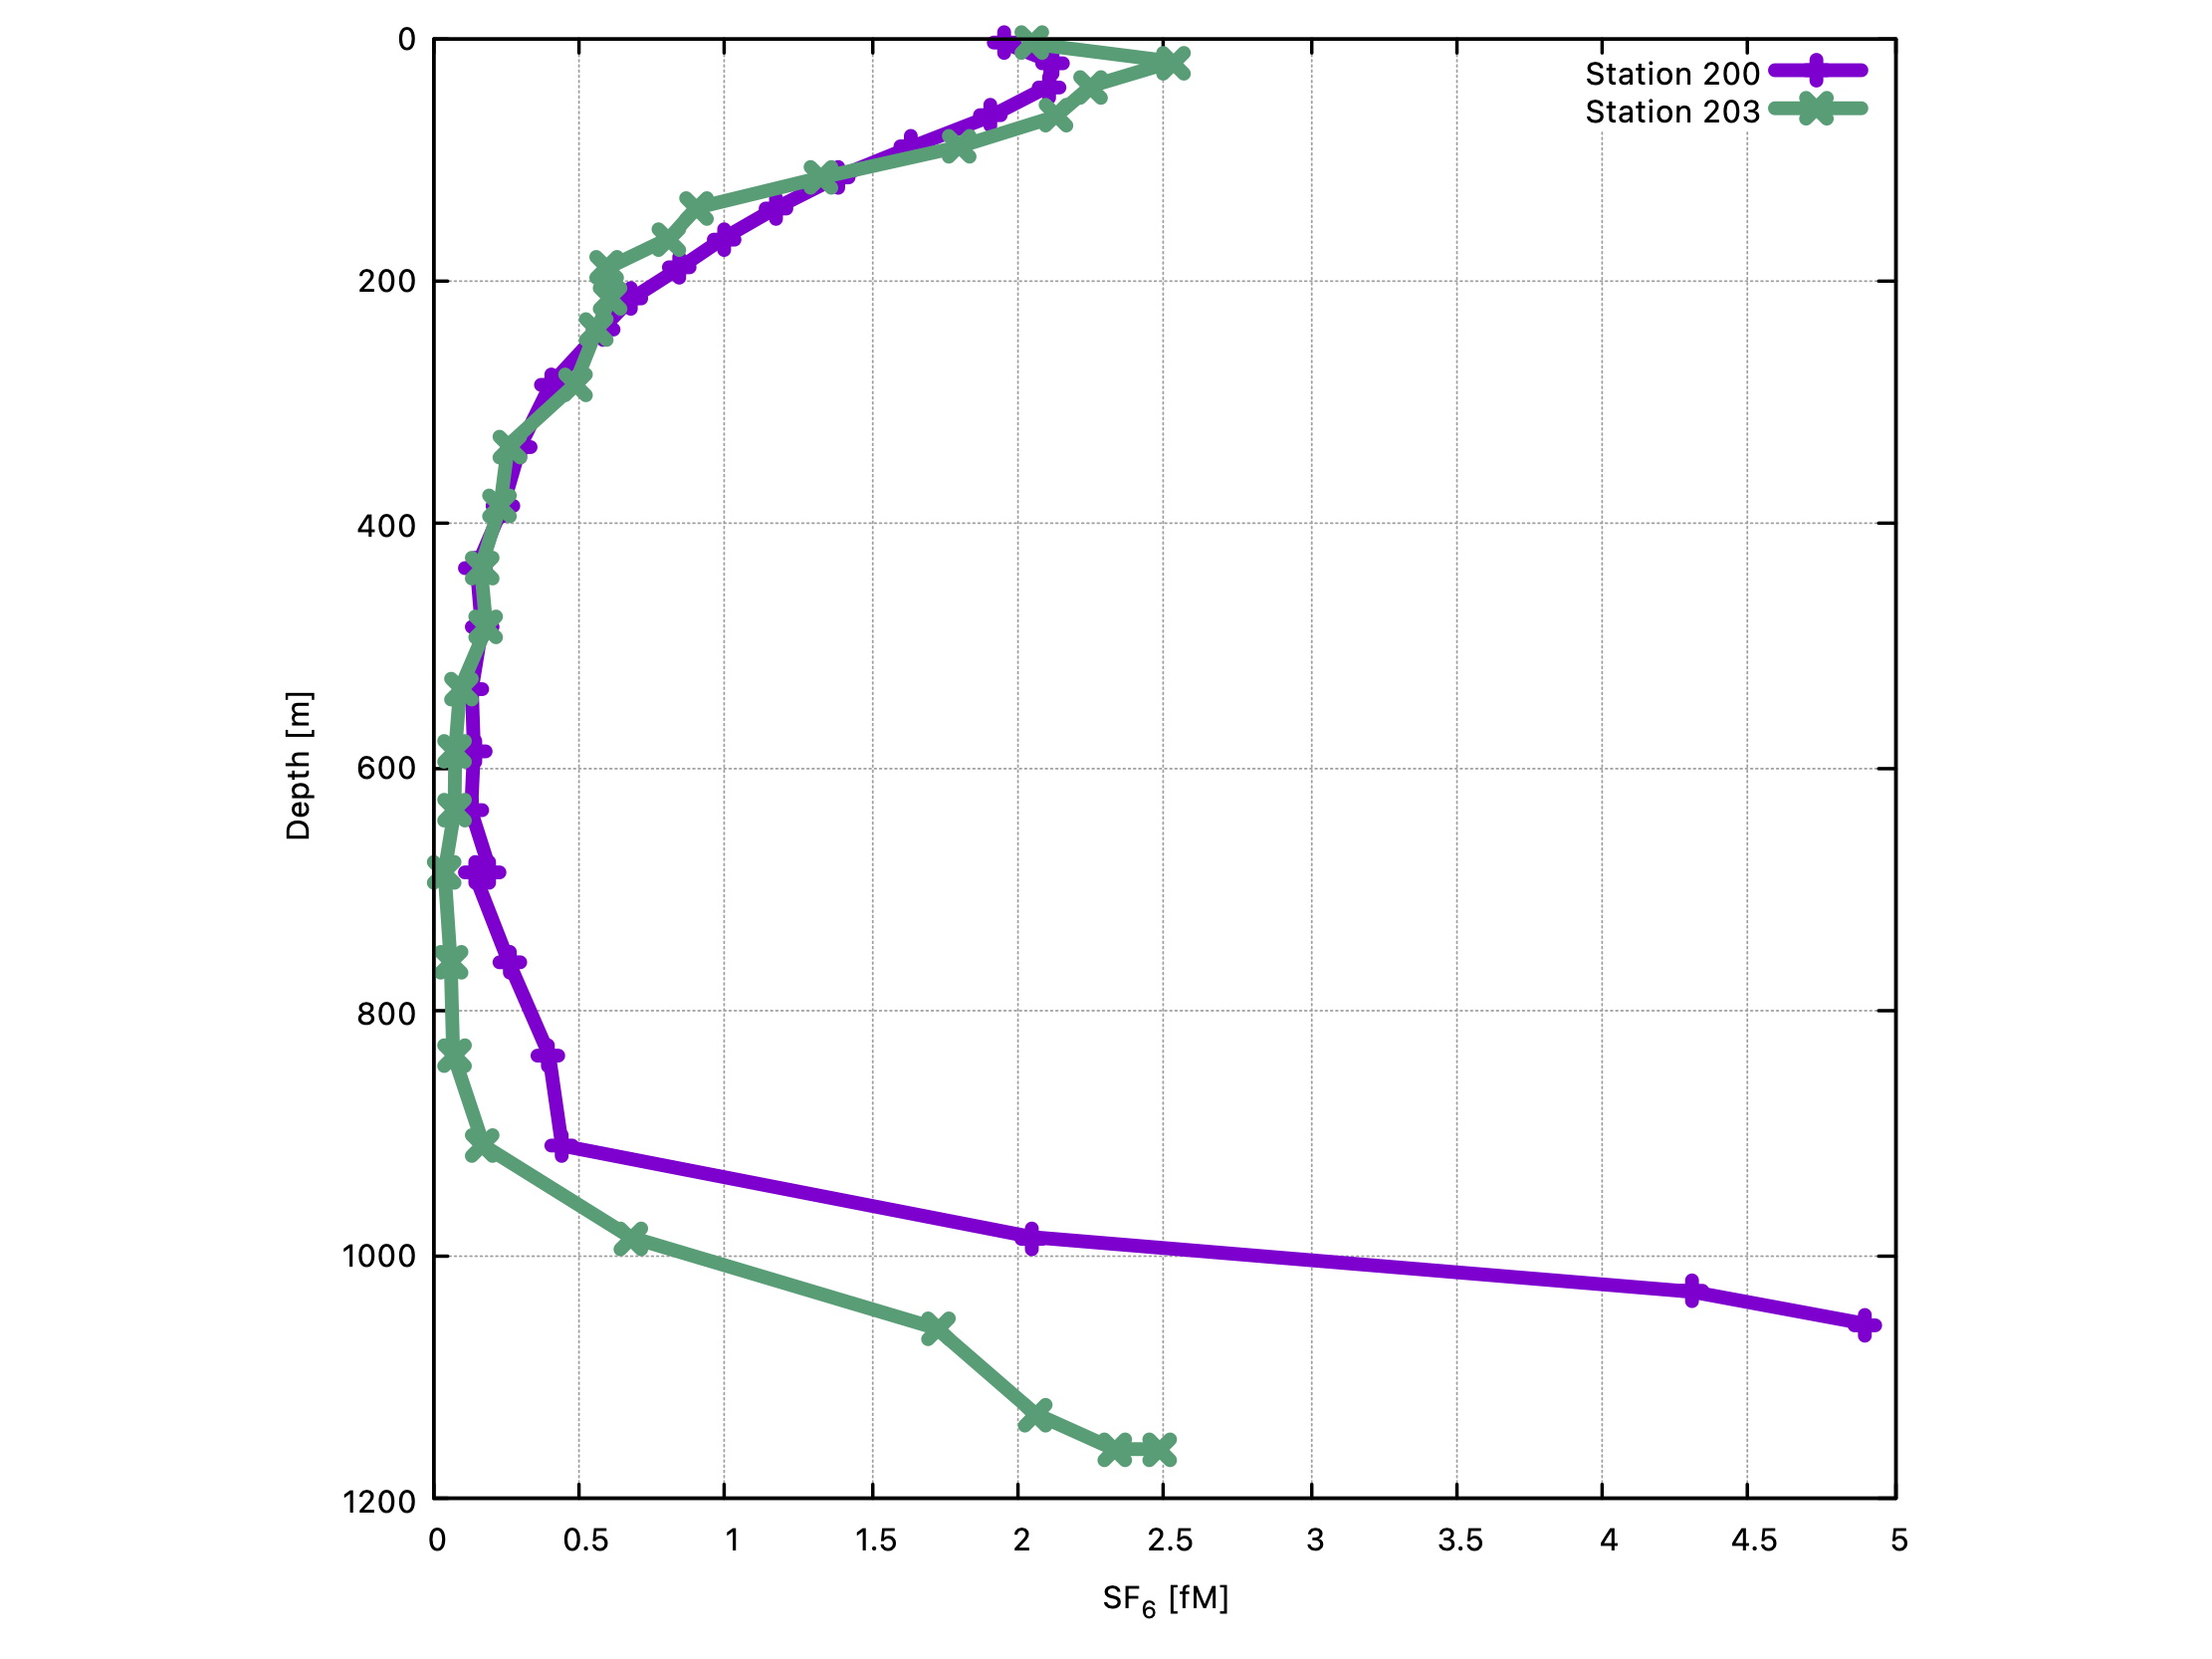
Profiles of sulfur hexafluoride (SF6) collected on two stations on the California shelf.